Boosting Information, Boosting Knowledge
Spectroswiss software solutions provide a step-change in mass spectrometry data quality and processing sophistication, helping you to take on the most complex and challenging applications. Our computationally-efficient tools are capable of processing large datasets, whether these are unreduced data (time-domain data or transients and full profile mass spectra) OR reduced data (reduced profile and centroided mass spectra). Our application-specific workflows enable step-by-step data processing and data analysis giving you the tools to powerfully investigate your samples.
Workflows
of Compound Classes

Individual Ion Counting

Workflows
Advanced Modular Software
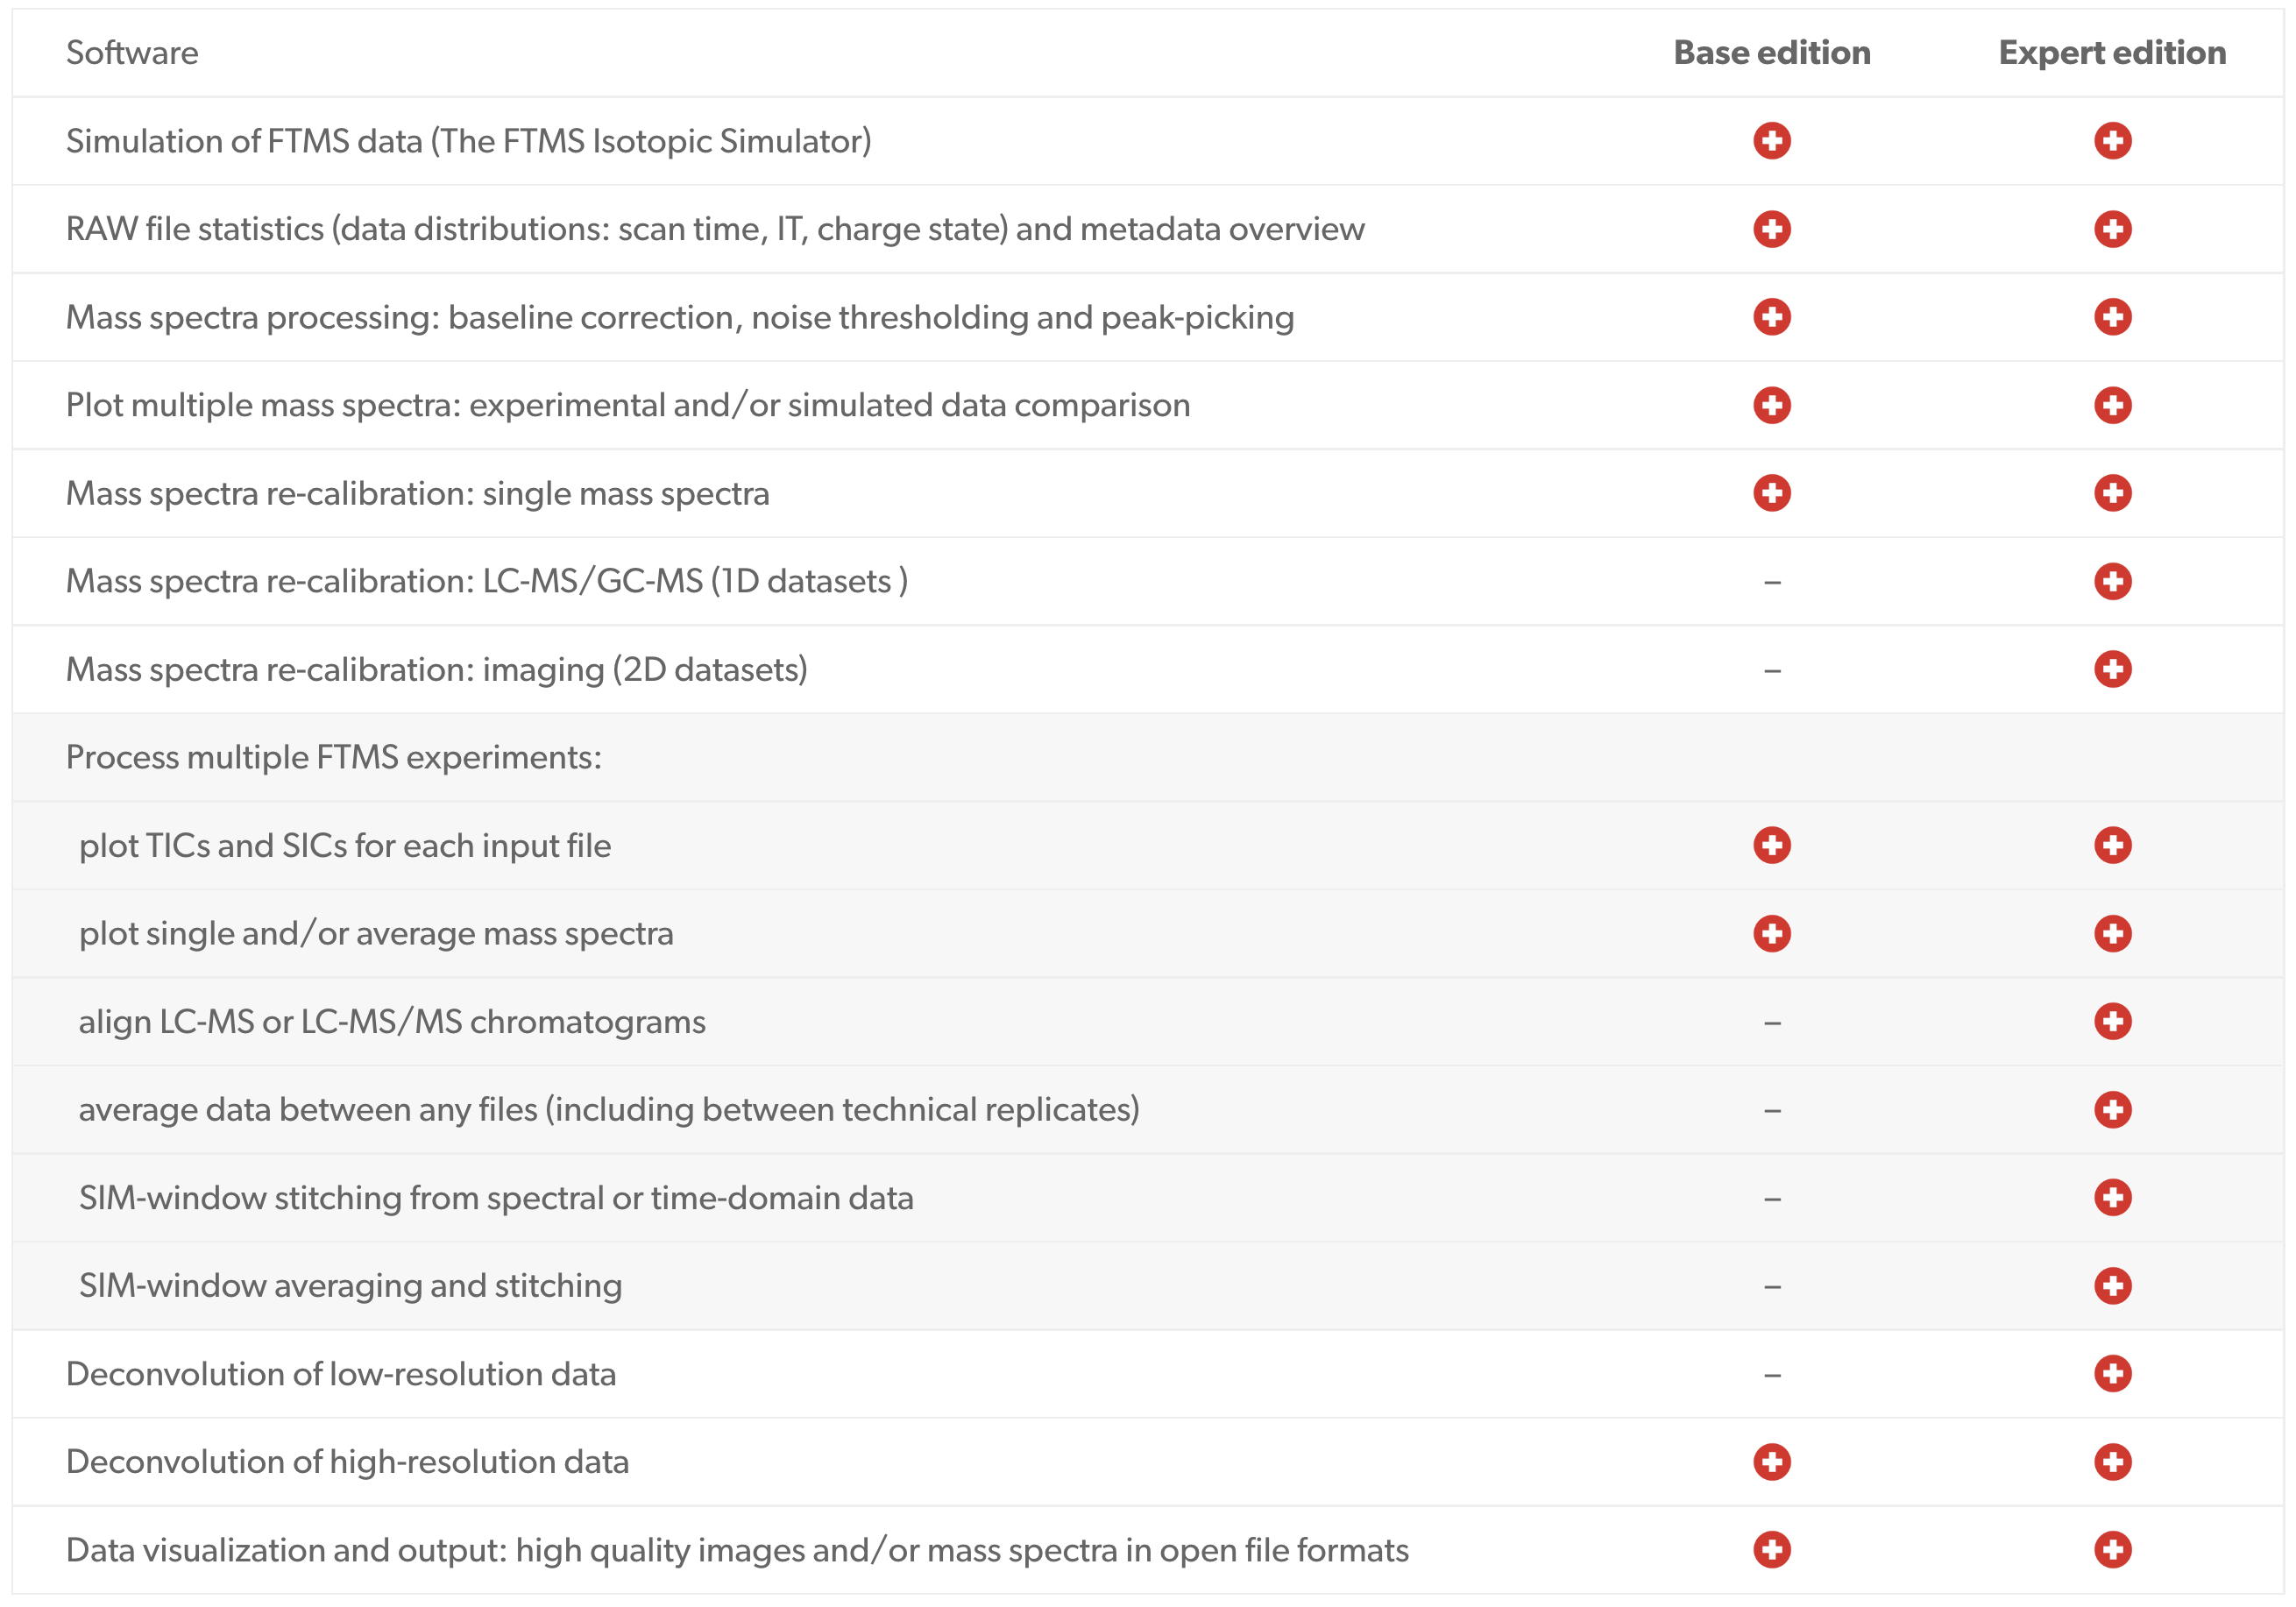
Peak-by-Peak suite: a set of computational modules with a graphic user interface to process transients or mass spectra configured into a basic (essential functionality) or expert (full functionality) editions.
Editions
Workflows
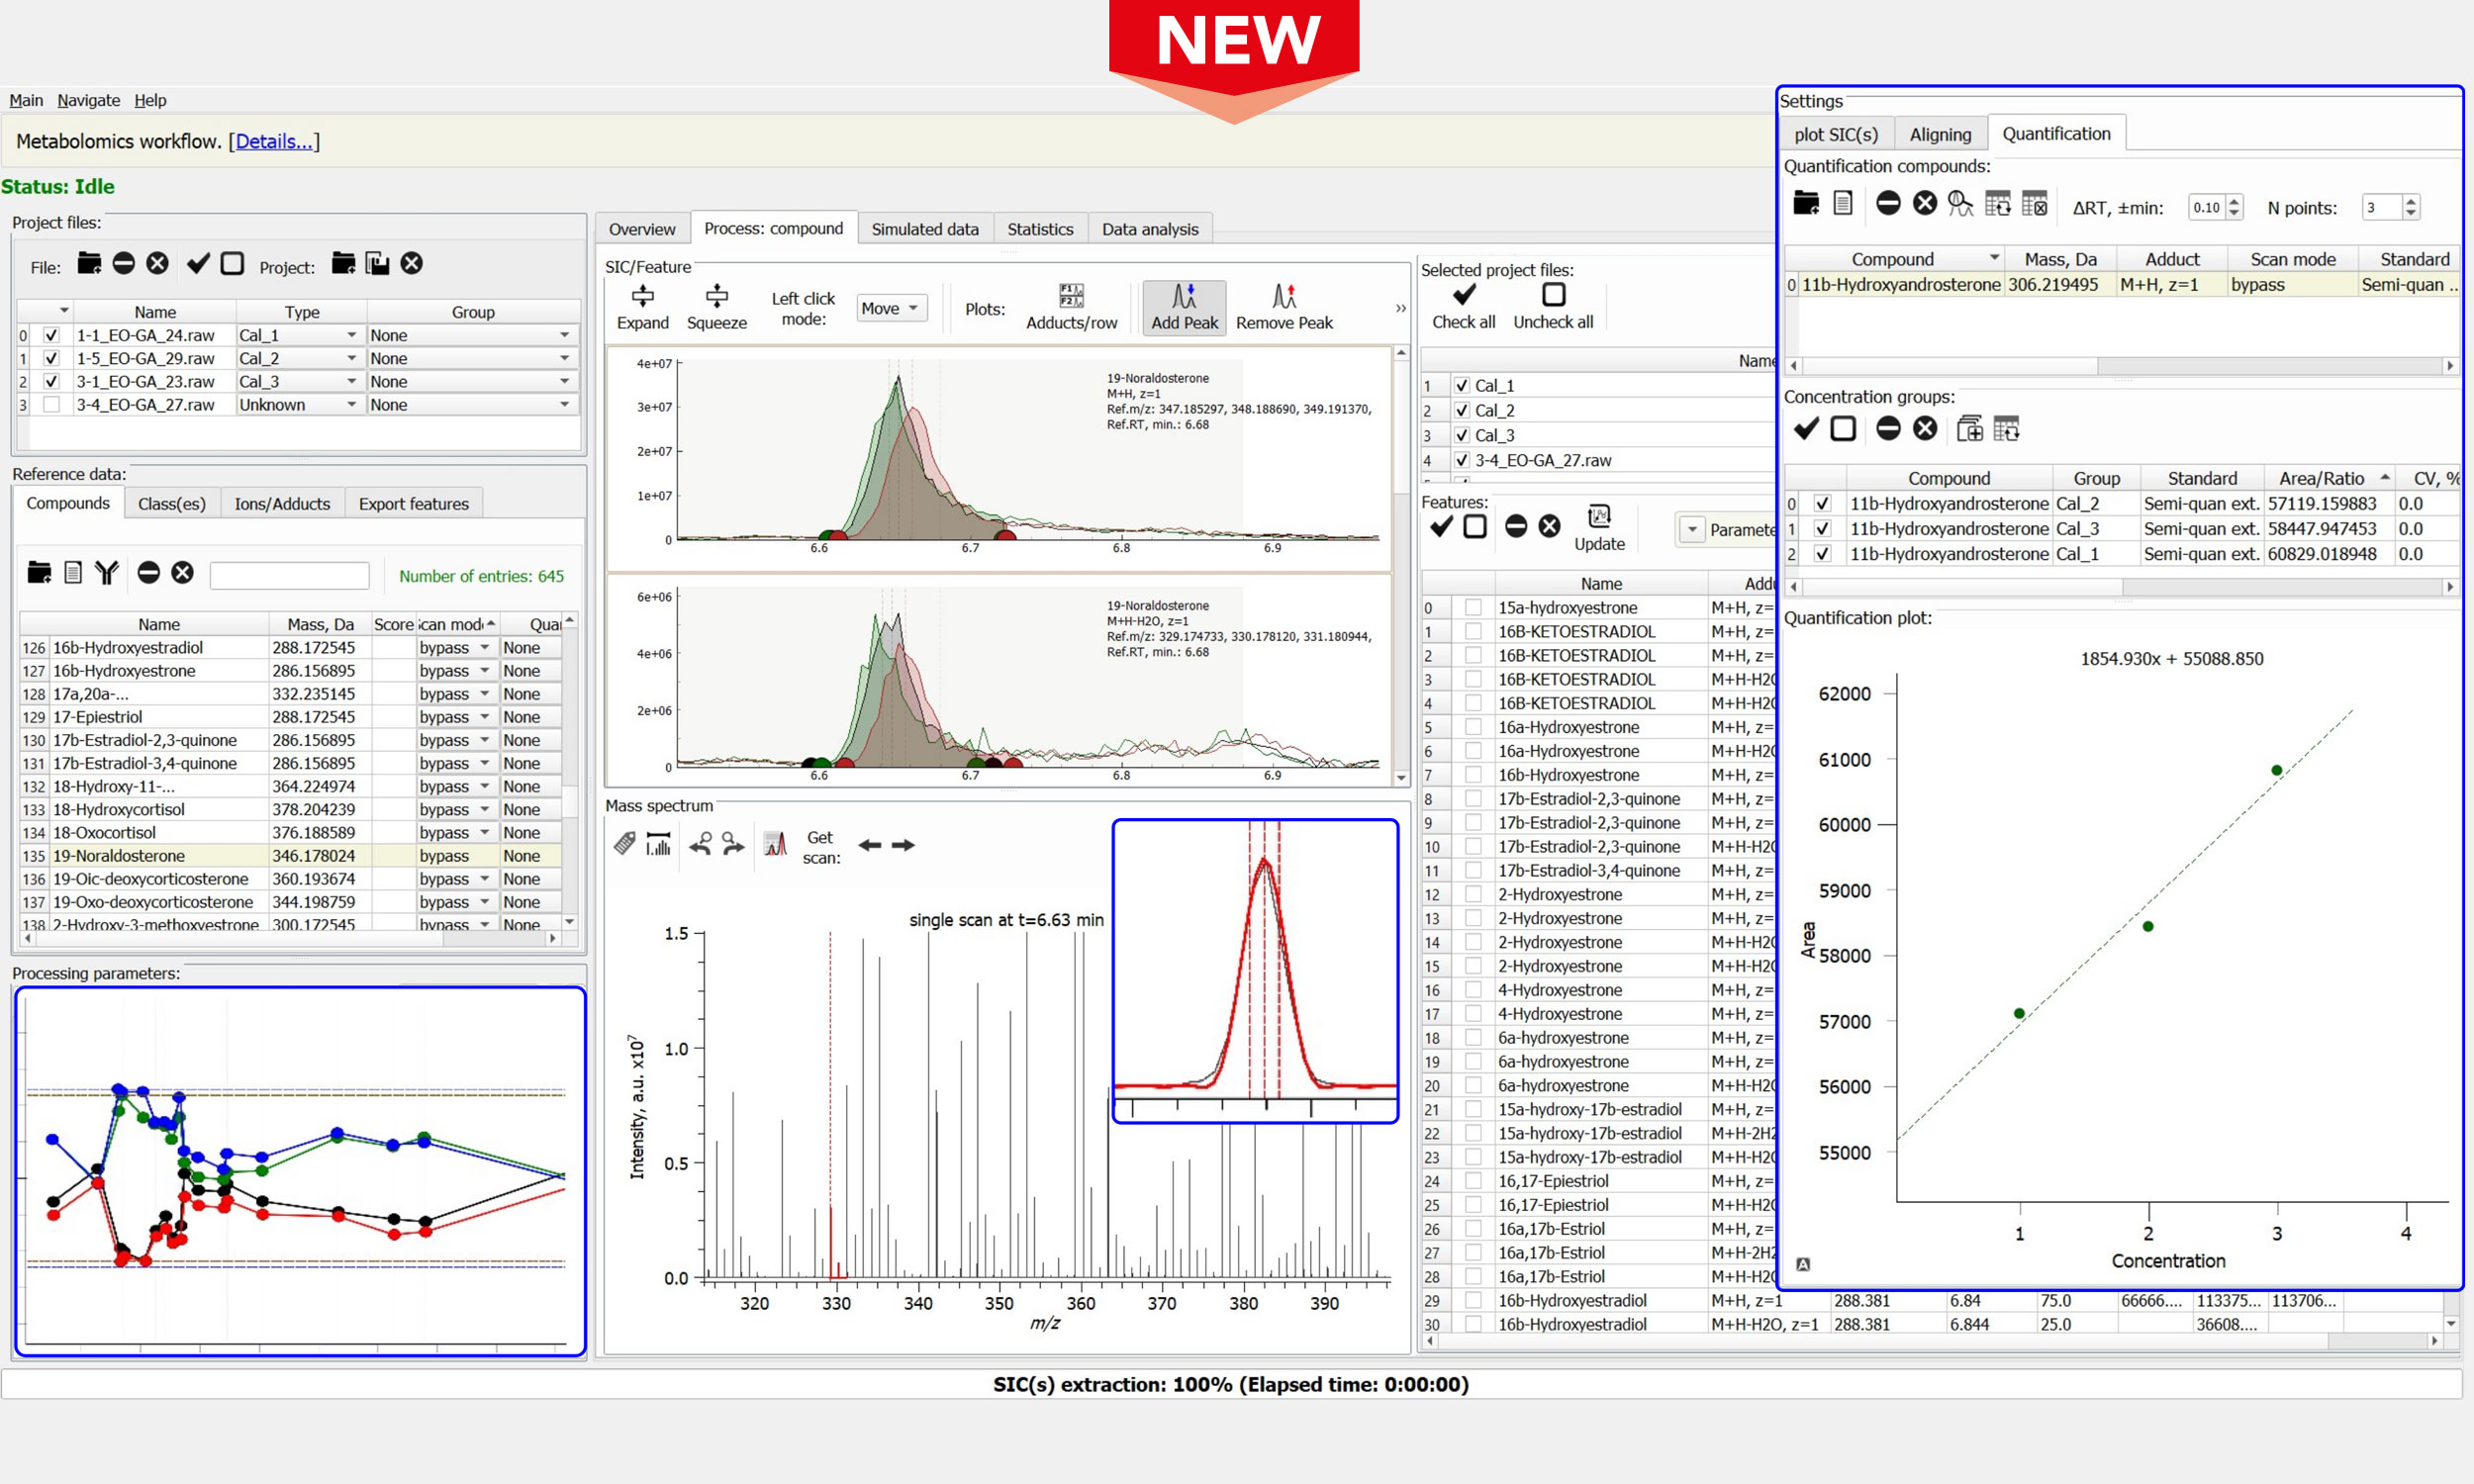
Quantitative Metabolomics & Lipidomics
- A multi-vendor platform for data processing and analysis from diverse mass spectrometers, supporting both LC-MS and GC-MS, with an automated recognition of meta-information
- Data processing based on the target and semi-target databases of individual compounds of interest
- Aligning of LC-MS experiments with or without extracted feature lists: targeted and untargeted approaches
- Accurate peak picking and diverse mass accuracy evaluation and re-calibration procedures
- Reliable feature extraction via experimental data matching with the simulated isotopic envelopes
- Quantification of compounds (area under the curve): absolute, standard, and semi-quantification
- Elemental formula assignment by accurate mass, with a similarity score ranking vs the simulated data
- Support for batch file processing of large data sets: practically any number of LC-MS datasets
- Comparative analysis of extracted features via a dynamic global result matrix, user-defined output reports
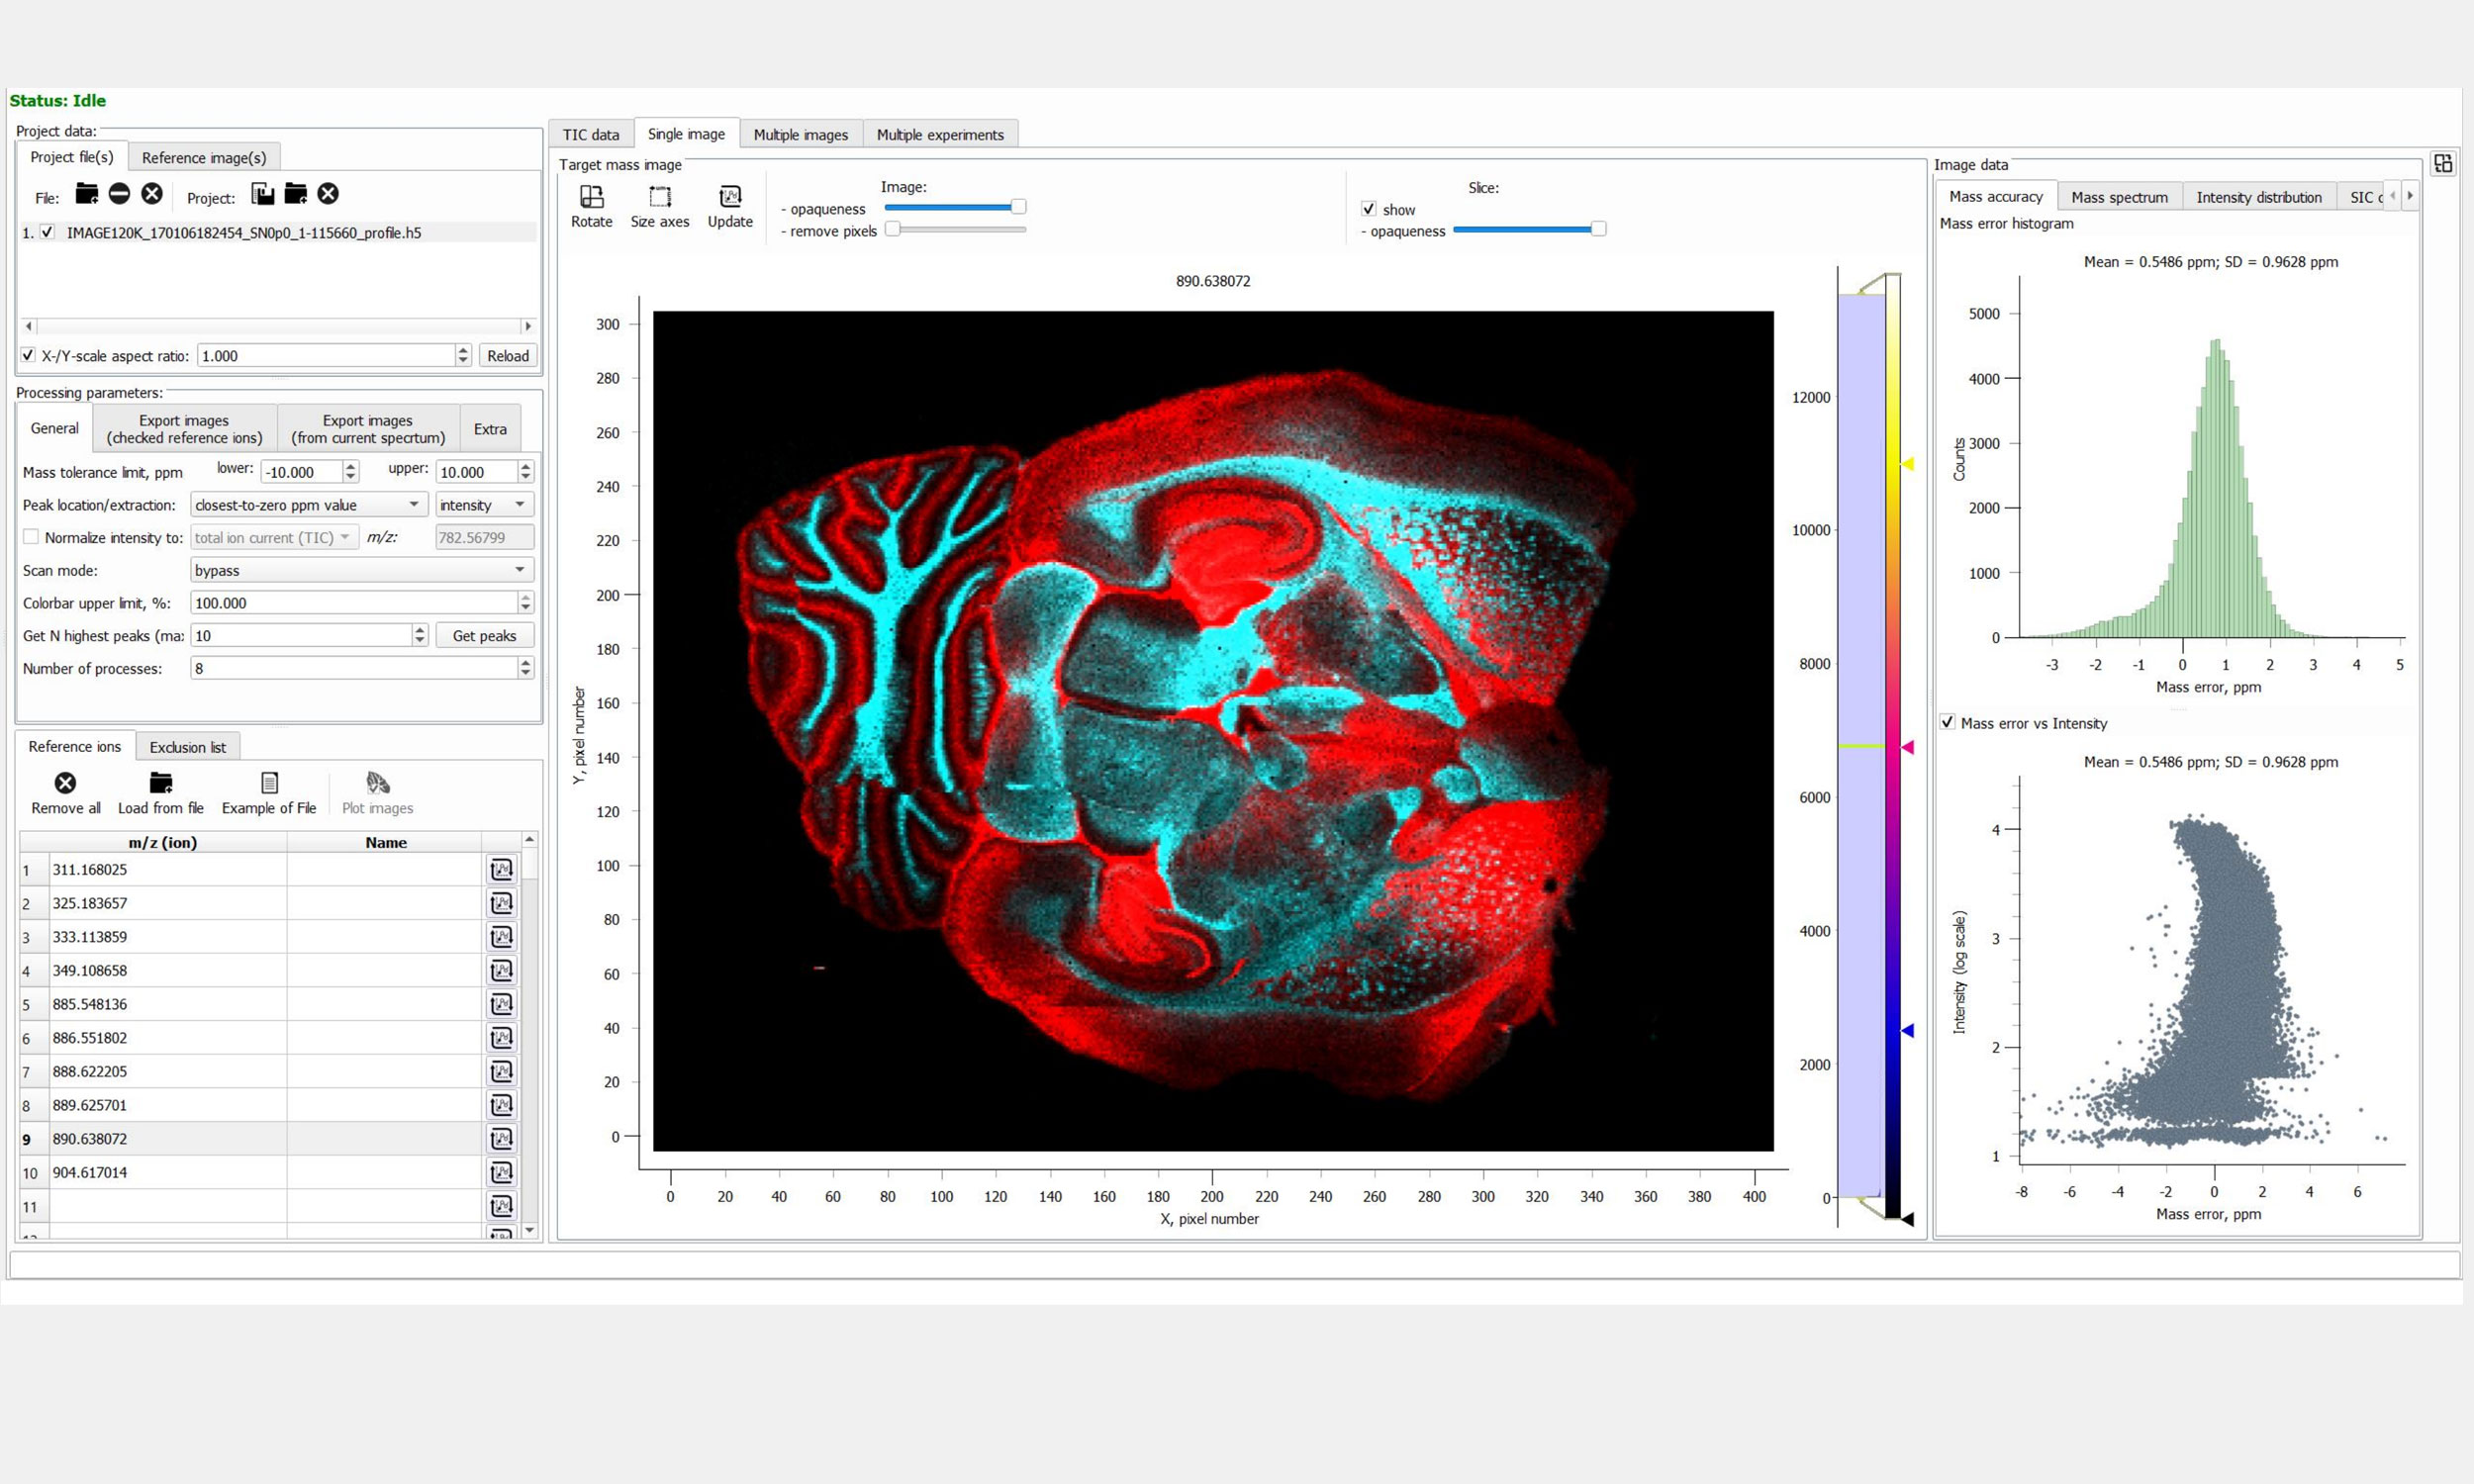
MALDI & DESI Imaging
- A multi-vendor platform for MSI data processing and analysis from diverse MS instruments, including
- OrbitrapTM FTMS, FT-ICR MS, MRT MS, TOF MS, and QQQ MS with and without ion mobility
- A direct data import of major vendor file types accompanied by import of MSI data in the imzML file format
- Support for MALDI and DESI sources (MassTech, Spectroglyph, TransMIT, and others)
- Automatic recognition of acquisition modes (MS, MS/MS, SIM, etc.), ion sources, and ion polarity
- Data validation and correction (re-calibration) through several mass accuracy evaluation capabilities
- Basic and advanced mass spectra and time-domain transient processing with user-defined parameters
- Instant visualization (click & see) and processing of images: normalization, noise reduction, hotspot removal
- Regions of interest (ROI) definition, analysis and geometry handling, comparative analysis
- Co-localization and overlay of (multi-mode) images, image weighted transparency and many color options
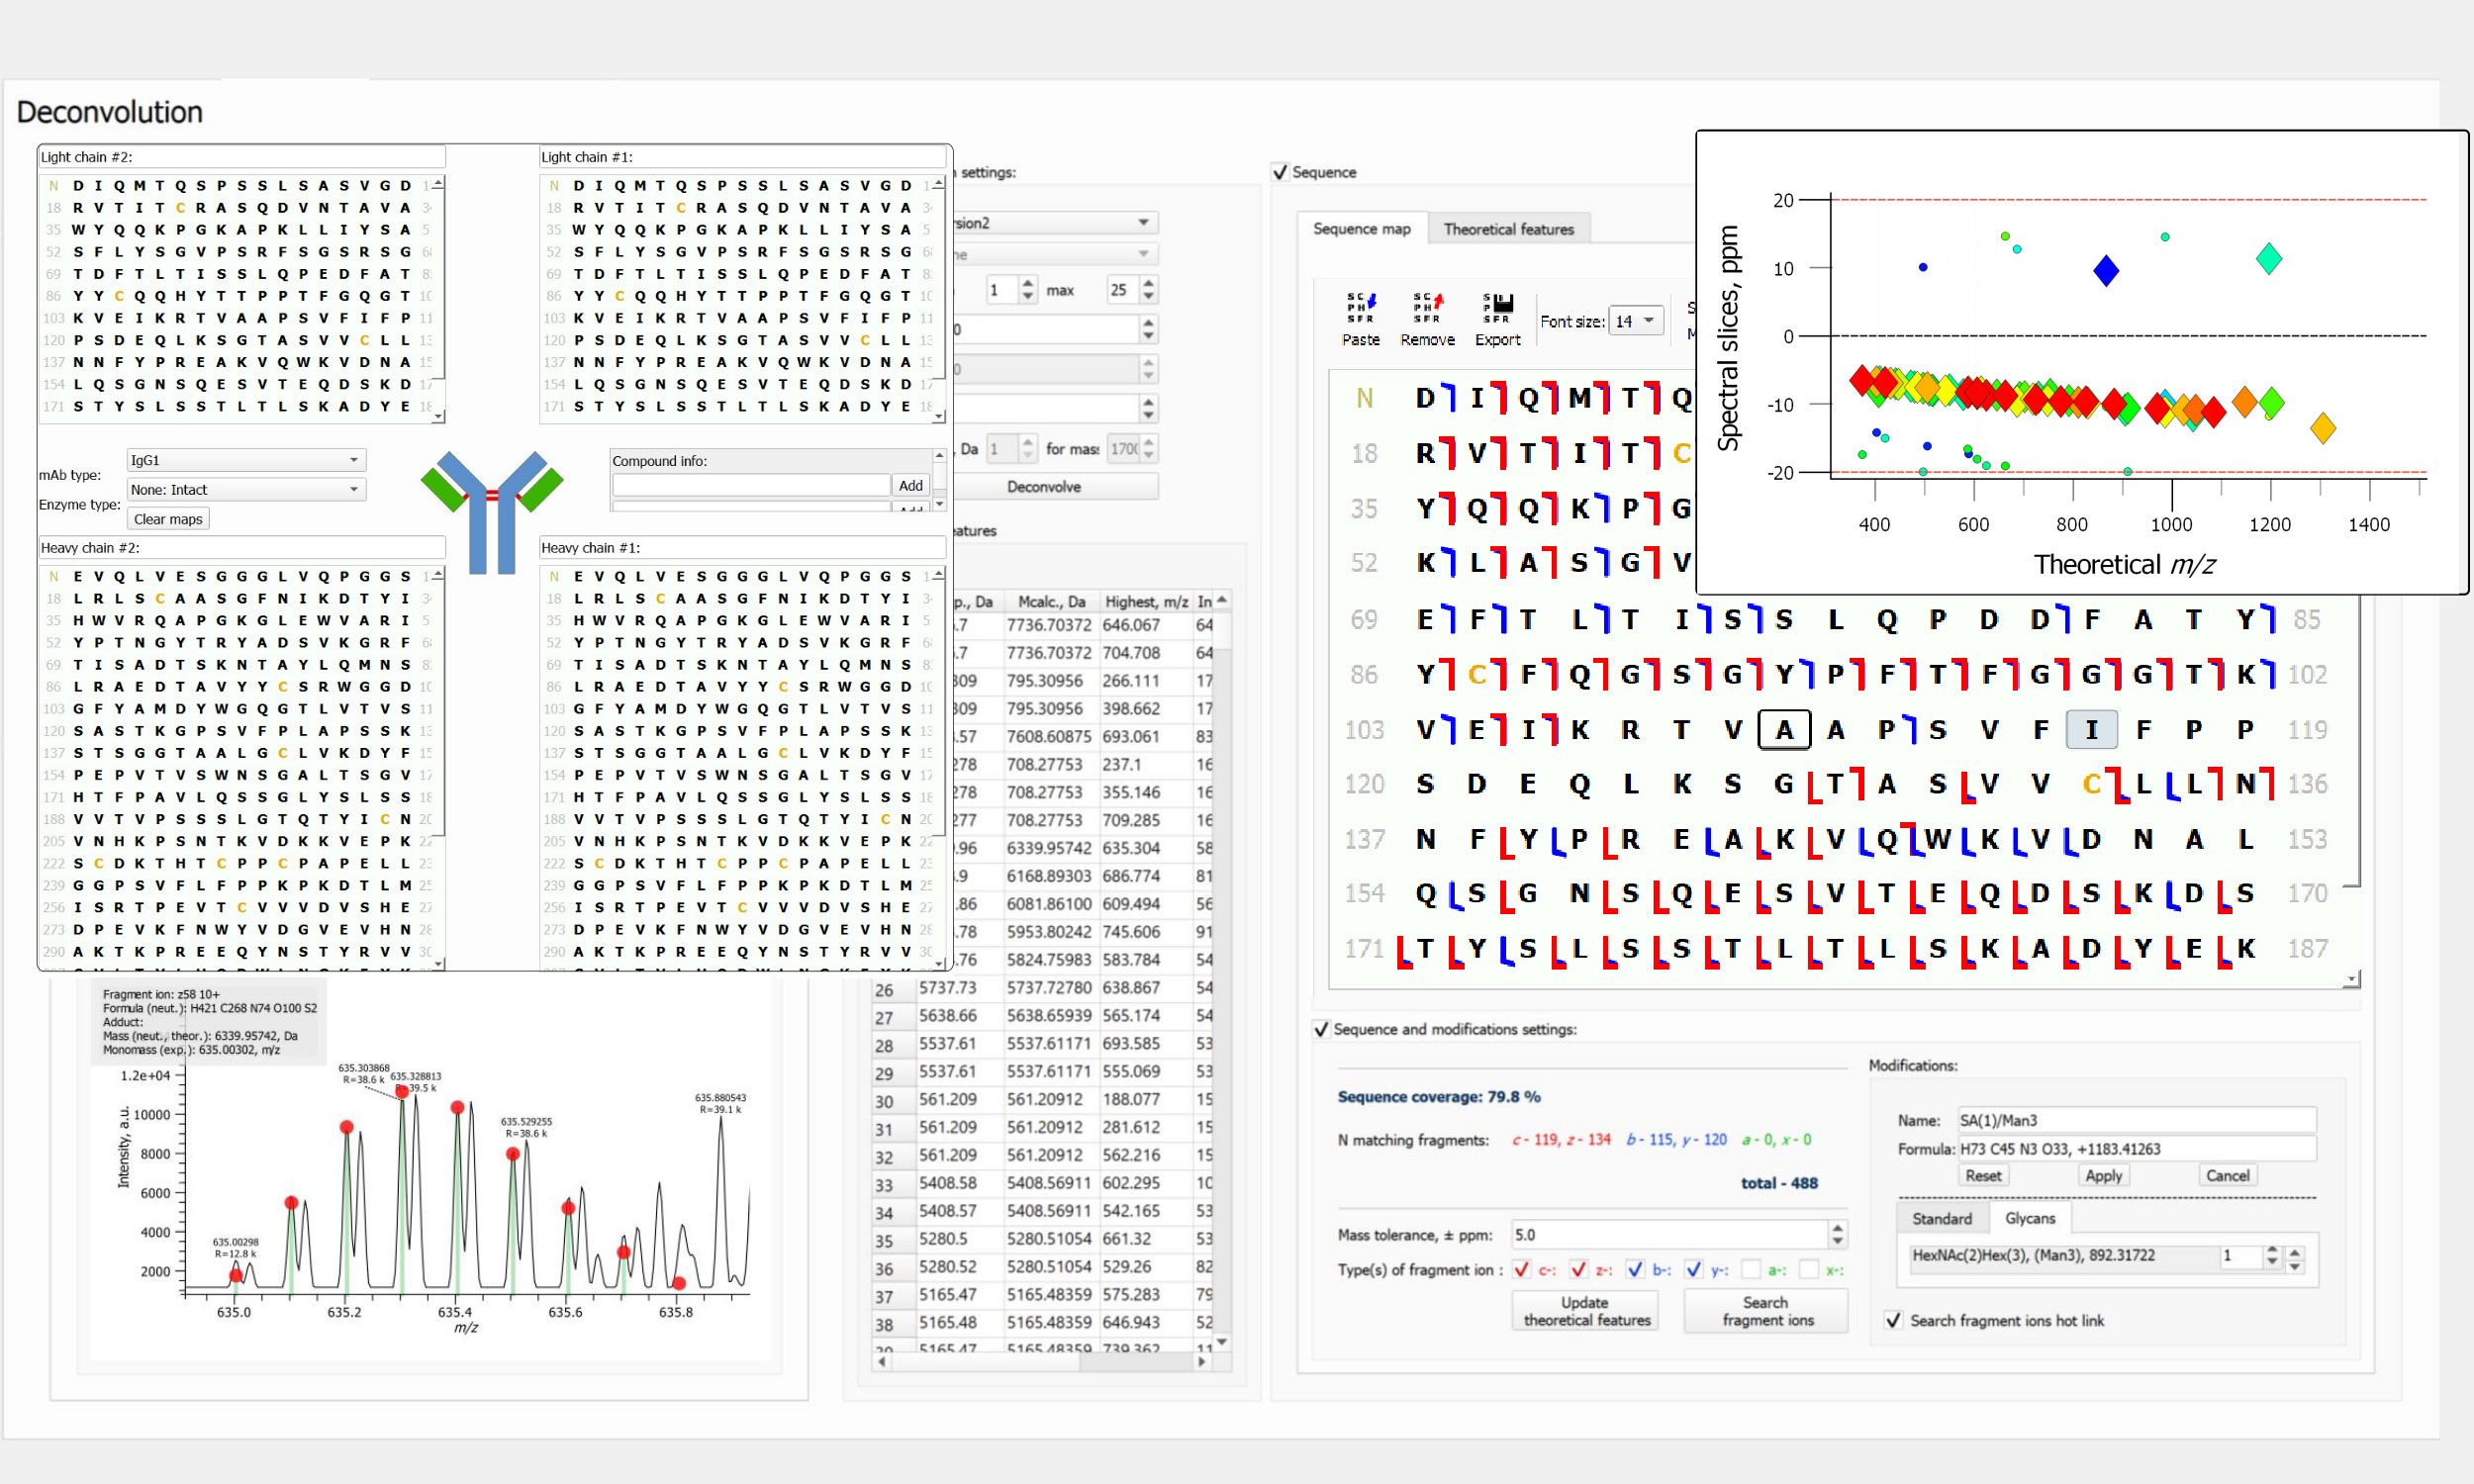
Protein Analysis (BioPharma)
- Advanced and proprietary mass spectrometry solutions for mAb analysis, including complex ADCs/AOCs
- Integration of intact mass and middle-up mass spectrometry approaches
- Sensitivity boost: data averaging of LC-MS,direct infusion MS data from multiple experiments (replicates)
- Targeted (direct) deconvolution via simulation of mass spectra from proteoform sequences and modifications
- High-resolution (FLASH Deconv) and low-resolution (UniDec) untargeted deconvolution, charge state grouping
- Recalibration of intact (MS data) mass spectra and mass accuracy evaluation procedures
- Annotation and quantification of proteoforms (via area under the curve in LC-MS)
- Graphical output (high quality images), interactive and PDF reports with mass spectral data and peak lists
- User-defined automation options for data input, processing, and reporting
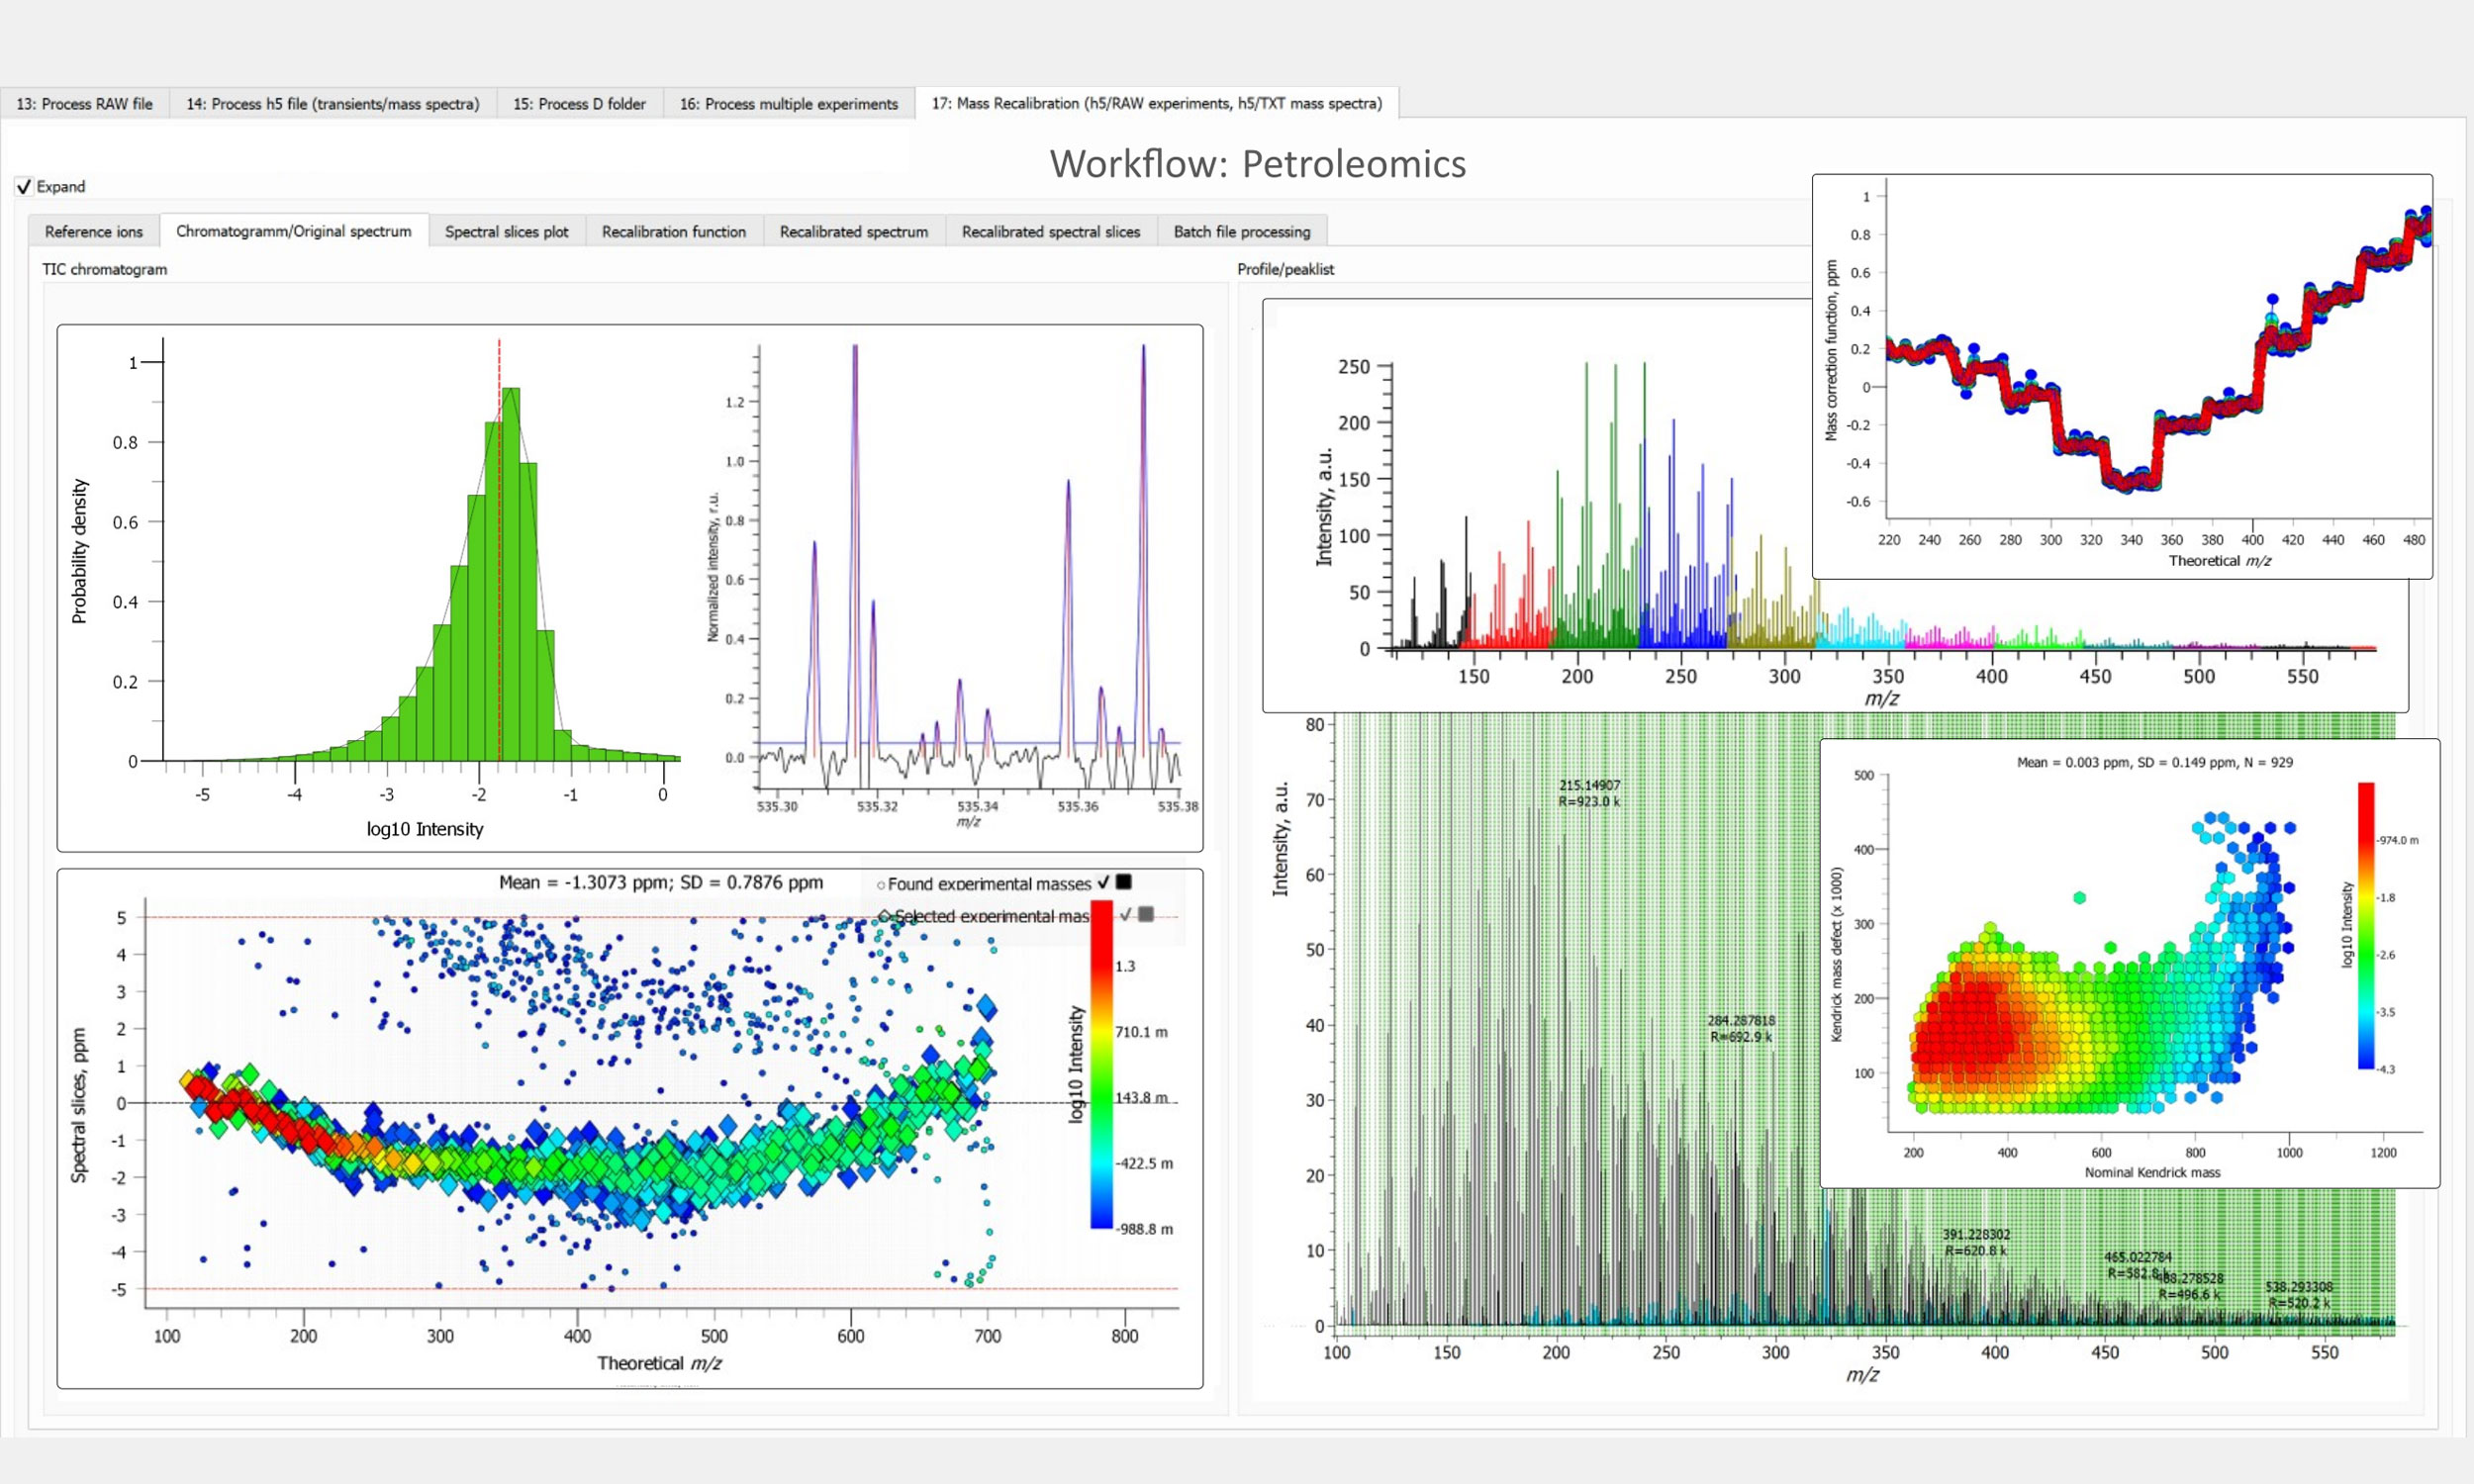
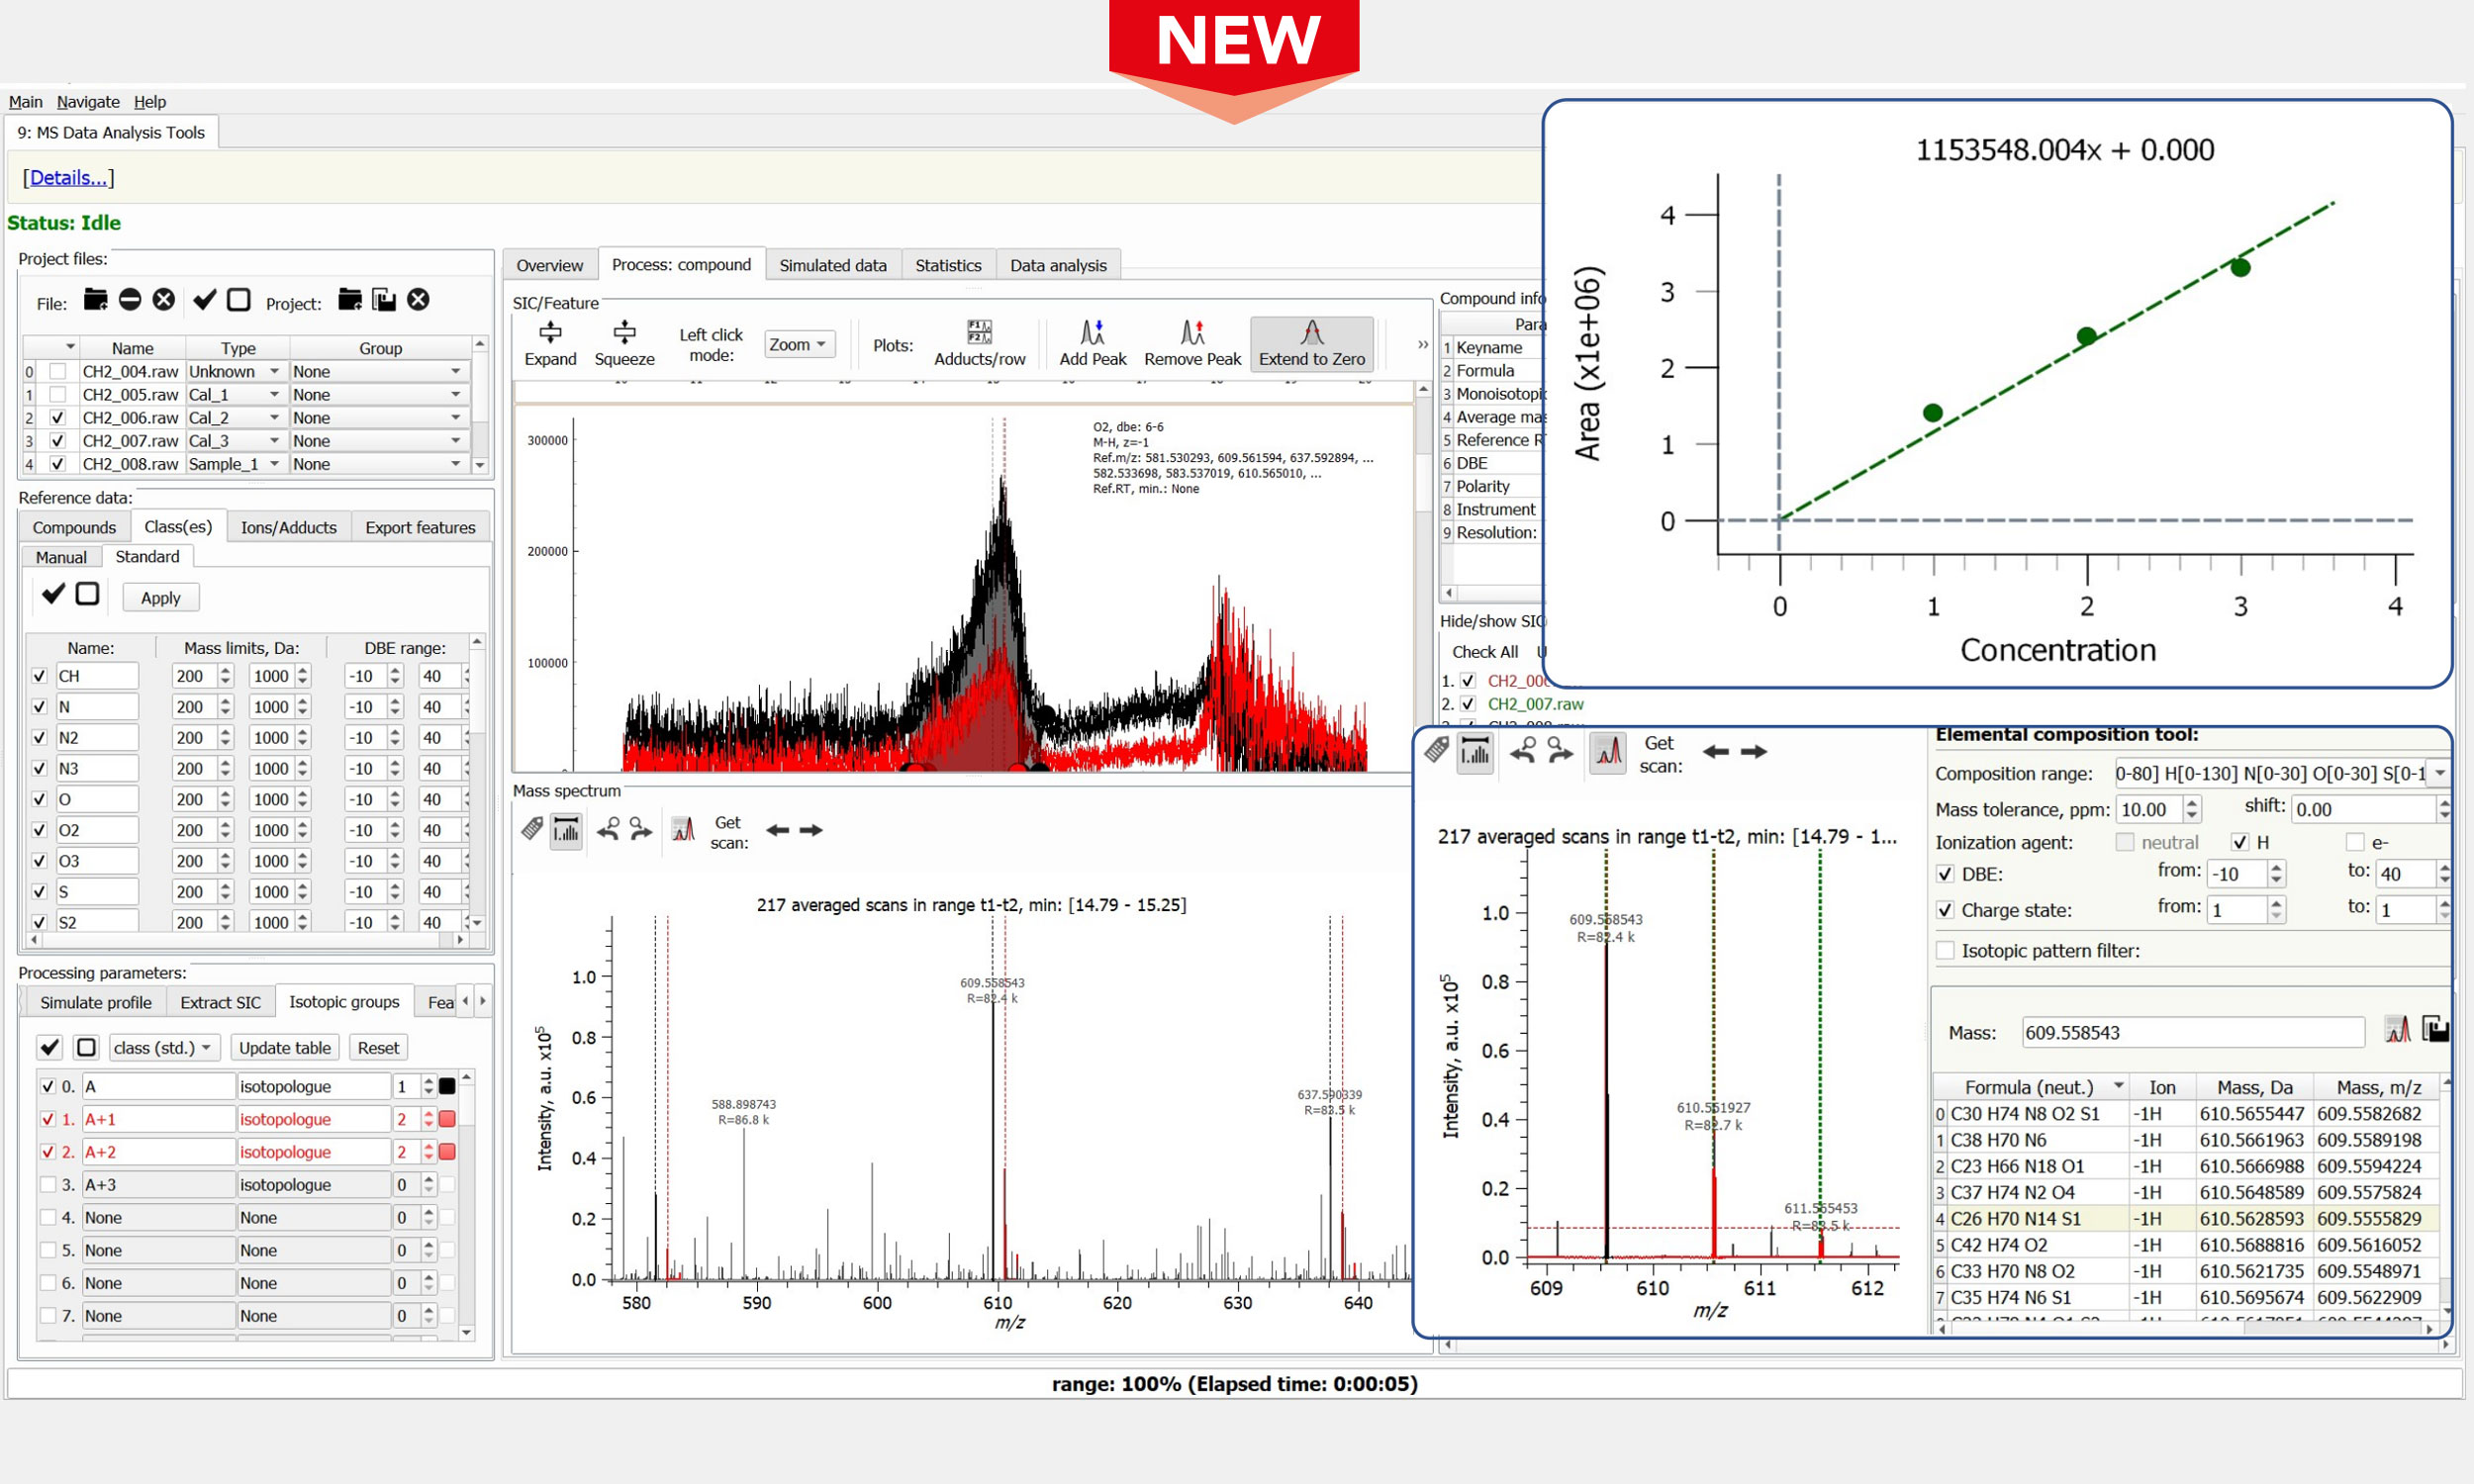
Complex Mixture Analysis
- Integration and processing of mass spectra of practically any size (.RAW, .d folders, and .H5 files)
- Open file formats for time-domain transients & mass spectra: H5, DAT, MGF, mzXML, and mzML
- Visual comparison of time-domain transients and mass spectra from separate data sets
- Spectral and time-domain transient averaging for higher sensitivity and dynamic range in MS & LC-MS
- Processing of LC-MS data for complex mixtures analysis, e.g., in petroleomics and biofuels applications
- Narrow m/z window (SIM) stitching of the unreduced and reduced data for enhanced performance
- Advanced peak picking and baseline correction, noise thresholding, mass spectral data reduction
- Mass scale calibration equations, including iterative re-calibration for complex mixtures analysis
Top-Down & Middle-Down Analysis
- All the features of the Peak-by-Peak BioPharma workflow for intact mass protein analysis
- Integration of middle-down, top-down, and bottom-up mass spectrometry approaches
- Sensitivity boost: data averaging of LC-MS/MS and MS/MS data from multiple experiments (replicates)
- Targeted (direct) deconvolution via simulation of product ion isotopic envelopes and mass spectra
- High-resolution (FLASH Deconv and Hardklor) untargeted deconvolution, charge state grouping
- Recalibration of middle-down and top-down (MS/MS data) mass spectra and mass accuracy evaluation
- Interactive graphical representation of sequence maps (add proteoforms, remove assignments, etc.)
- Graphical output (high quality images), interactive and PDF reports with MS/MS data and sequence maps
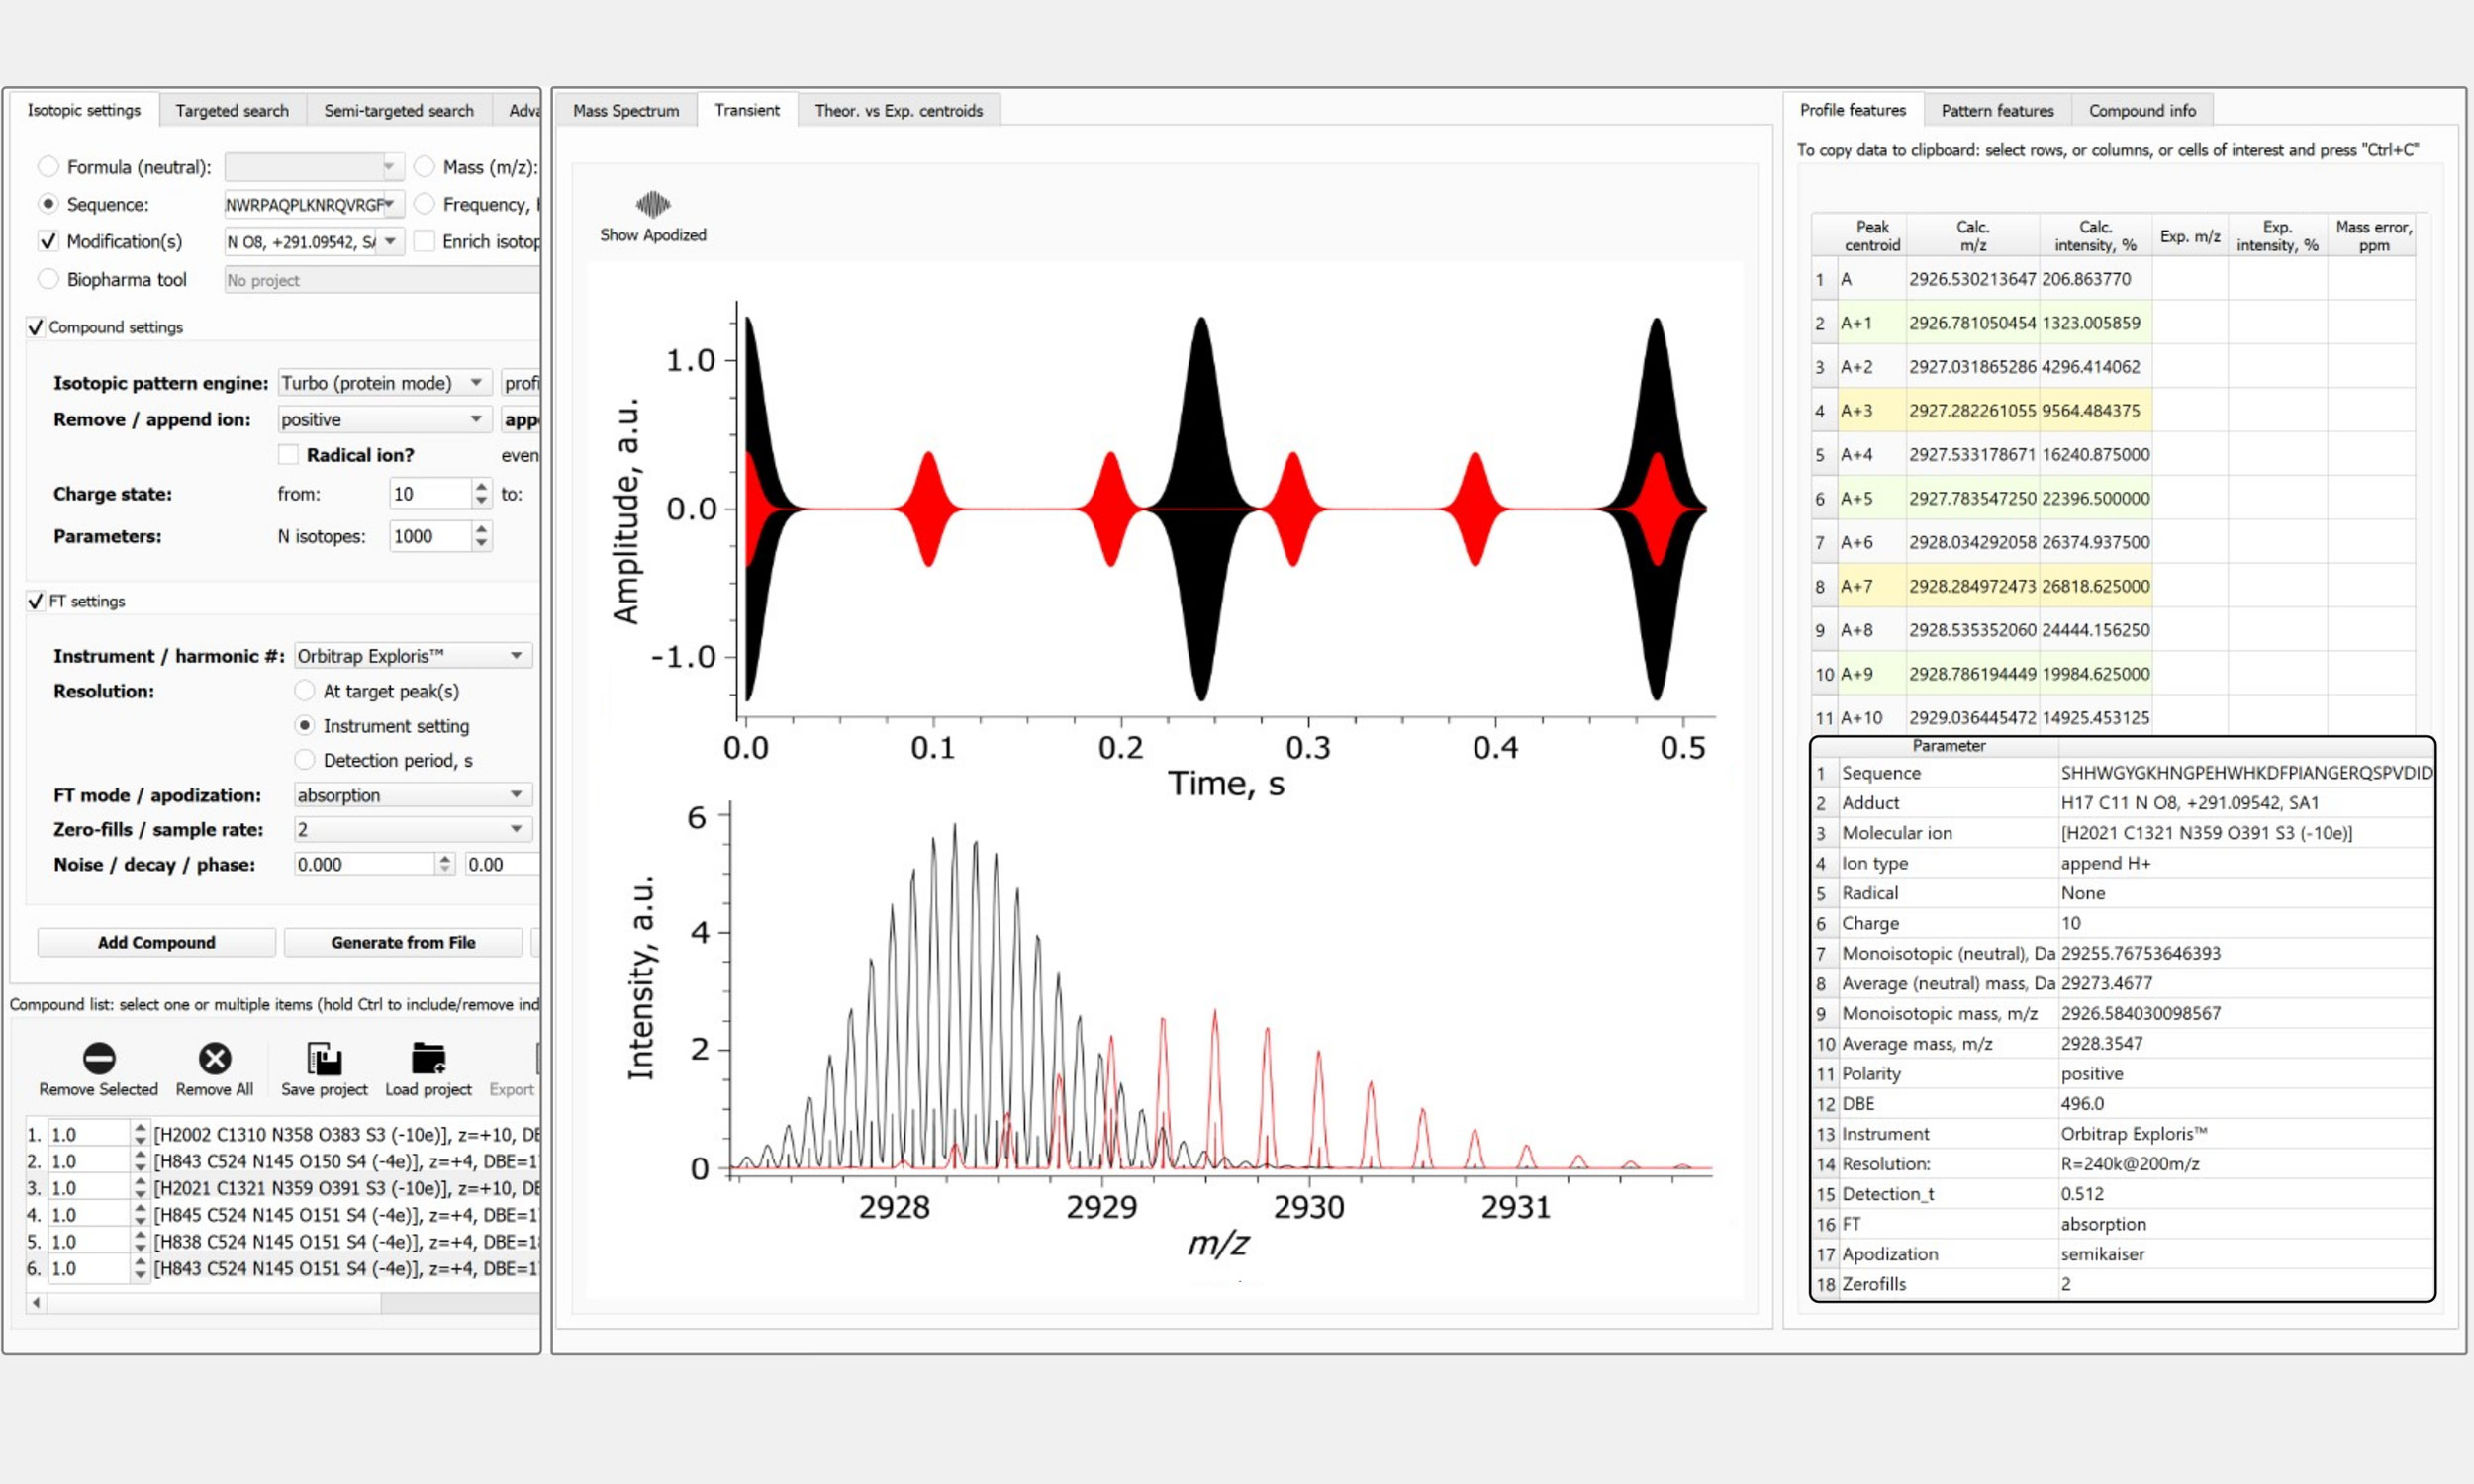
FTMS Simulator (Protein-grade!)
- Analyte parameters selection: elemental composition, amino acid sequence, charge carrier, modifications, isotopic enrichment/depletion, number of charge states, and number of isotopologues
- FTMS experiment parameters: FTMS instrument selection (models of Orbitrap & ICR), resolution setting (@ m/z), add noise, set signal intensity thresholds, set initial phase, sampling rate, and decay rate
- Data processing parameters: absorption or magnitude FT, unapodized or apodization function, number of zero-fills, full or reduced profile mass spectra, centroids
- Applicable to (almost) any size molecules – from metabolites to monoclonal antibodies and viruses
- Applicable to (almost) any complexity mass spectra – from isotopic envelopes to full scale top-down mass spectra
- Results output and applicability: use simulated data to search experimental data, rank search results by the similarity score (m/z, intensity), save project for future use, create report as a PDF file
Quantitative LC/GC-MS analysis of Compound Classes
- All the features of the Peak-by-Peak Metabolomics workflow
- Input of target and semi-target databases of pre-set and user-defined classes of compounds of interest
- Quantification of classes of compounds (via area under the curve in LC/GC-MS):
– absolute quantification (labelled compound classes as internal standards, ratio of analyte compound classes signal to the internal standard compound classes)
– semi-quantification (internal standards provide quantitative information, expressed as areas under the curve; information used for other compound classes)
– semi-quantification, standard addition (external calibration) - Graphical output (high quality images), interactive and PDF reports with mass spectra and peak lists
CDMS: Individual Ion Counting
- Access to the time-domain transients from OrbitrapTM and ICR FTMS instruments via our proprietary add-on high-performance data acquisition systems – FTMS Boosters
- Wide range of time-domain data processing parameters: absorption/magnitude FT, apodization function, number of zero-fills, full or reduced profile mass spectra, centroids, visualize transients
- Advanced time-domain data processing, including STORI (selective temporal overview of resonant ions) approach
- User-controllable multi-iterative conditional filtering, averaging, and feature detection
- Charge calibration and charge grouping procedures
- Results comparison with conventional approaches for time-domain transient analysis (data averaging)
Custom Workflows
- UVPD spectroscopy
- Bottom-up glycoproteomics
- TMT-based multiplexed protein quantitation